An Argo float drifts for years. Mapping the track gives intuition about the regional circulation and the spatial representativeness of the profiles.
%run _style.py
import numpy as np
import xarray as xr
import matplotlib.pyplot as plt
import cartopy.crs as ccrs
import cartopy.feature as cfeature
from argopy import DataFetcher
from _style import PALETTE

ds_point = DataFetcher(src='erddap', mode='standard').float(5905141).to_xarray()
ds = ds_point.argo.point2profile()

lons = ds.LONGITUDE.values
lats = ds.LATITUDE.values
times = ds.TIME.values
print(f'{len(lons)} cycles · from {str(times.min())[:10]} a {str(times.max())[:10]}')
print(f'lat {lats.min():.1f} a {lats.max():.1f} · lon {lons.min():.1f} a {lons.max():.1f}')
312 cycles · from 2017-10-24 a 2022-01-13
lat -36.5 a -32.4 · lon -47.6 a -25.3
Cartopy map
proj = ccrs.PlateCarree()
fig, ax = plt.subplots(figsize=(11, 8), subplot_kw={'projection': proj})
pad = 4
ax.set_extent([lons.min()-pad, lons.max()+pad,
lats.min()-pad, lats.max()+pad], crs=proj)
ax.add_feature(cfeature.LAND, color=PALETTE['land'], zorder=1)
ax.add_feature(cfeature.COASTLINE, lw=0.5, color=PALETTE['deep'])
ax.add_feature(cfeature.BORDERS, lw=0.3, color=PALETTE['gray'], alpha=0.6)
ax.gridlines(draw_labels=True, alpha=0.25, lw=0.4, color=PALETTE['gray'])
ax.plot(lons, lats, '-', color=PALETTE['blue'], lw=0.8, alpha=0.6, transform=proj)
t_num = (times - times.min()) / np.timedelta64(1, 'D')
sc = ax.scatter(lons, lats, c=t_num, cmap='viridis', s=15,
edgecolor='white', lw=0.25, transform=proj)
ax.plot(lons[0], lats[0], 'o', color=PALETTE['warm'], ms=11,
markeredgecolor='white', mew=1.5, label='deployed', transform=proj)
ax.plot(lons[-1], lats[-1], 's', color=PALETTE['orange'], ms=11,
markeredgecolor='white', mew=1.5, label='last cycle', transform=proj)
plt.colorbar(sc, ax=ax, label='days since deployment', shrink=0.7)
ax.legend(loc='upper left', frameon=False)
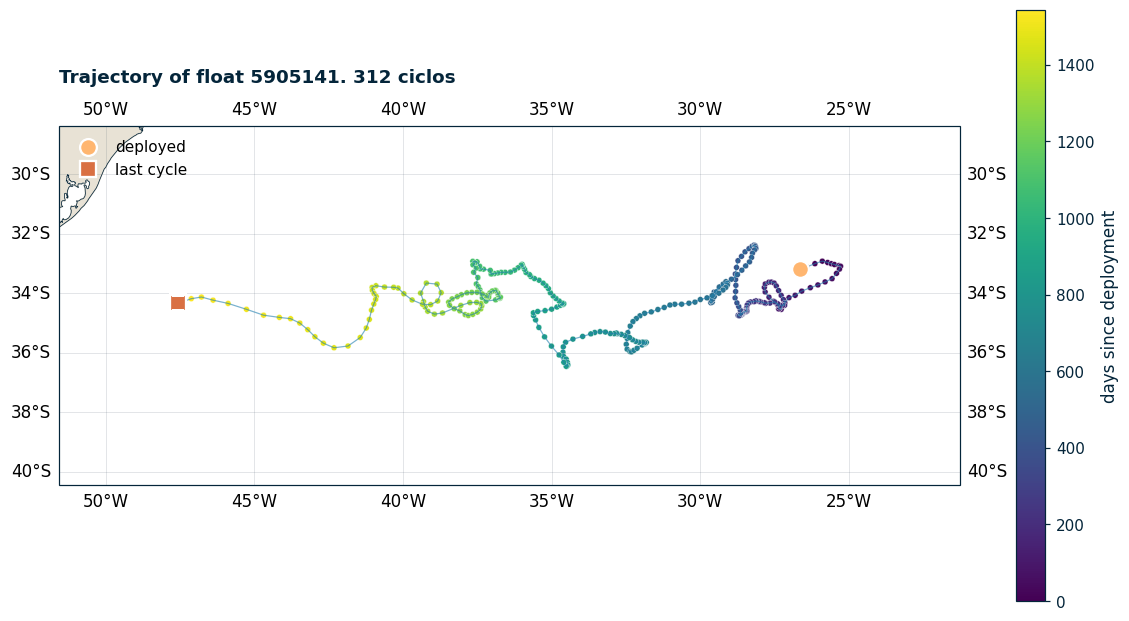
ax.set_title(f'Trajectory of float 5905141. {len(lons)} ciclos', loc='left')
plt.tight_layout()
plt.show()/Users/daniela/Documents/argo-tutorial/.venv/lib/python3.12/site-packages/cartopy/mpl/feature_artist.py:143: UserWarning: facecolor will have no effect as it has been defined as "never".
warnings.warn('facecolor will have no effect as it has been '
Dynamical context
This float was deployed in the South Atlantic, a region dominated by the Brazil-Malvinas confluence: the Brazil Current carries warm, salty subtropical water southward; the Malvinas Current carries cold, fresh subantarctic water northward. Their encounter forms one of the most energetic ocean fronts on the planet.
The track reflects this dynamics: during the ~9 days the float drifts at 1000 m, the local current advects it. Over months you see loops, recirculations, and eastward transport by the South Atlantic Current.
Multiple floats in a region
For decent spatial coverage, download all floats active in a box:
box = [-60, -30, -45, -25, 0, 100, '2022-01-01', '2022-12-31']
ds_reg = DataFetcher(src='erddap', mode='standard').region(box).to_xarray()
ds_reg_prof = ds_reg.argo.point2profile()

wmos = np.unique(ds_reg_prof.PLATFORM_NUMBER.values)
print(f'{len(wmos)} distinct floats · {ds_reg_prof.sizes["N_PROF"]} total profiles')
97 distinct floats · 2090 total profiles
fig, ax = plt.subplots(figsize=(11, 8), subplot_kw={'projection': proj})
ax.set_extent([-62, -28, -48, -22], crs=proj)
ax.add_feature(cfeature.LAND, color=PALETTE['land'], zorder=1)
ax.add_feature(cfeature.COASTLINE, lw=0.5, color=PALETTE['deep'])
ax.add_feature(cfeature.BORDERS, lw=0.3, color=PALETTE['gray'], alpha=0.6)
ax.gridlines(draw_labels=True, alpha=0.25, lw=0.4, color=PALETTE['gray'])

cmap = plt.get_cmap('tab20')
for k, wmo in enumerate(wmos):
    m = ds_reg_prof.PLATFORM_NUMBER == wmo
    lo = ds_reg_prof.LONGITUDE.where(m, drop=True).values
    la = ds_reg_prof.LATITUDE.where(m, drop=True).values
    color = cmap(k % 20)
    ax.plot(lo, la, '-', color=color, lw=0.35, alpha=0.7, transform=proj)
    ax.scatter(lo, la, color=color, s=2.5, alpha=0.8, transform=proj)

ax.set_title(f'Active Argo floats in the South Atlantic. 2022 ({len(wmos)} floats)', loc='left')
plt.tight_layout()
plt.show()
/Users/daniela/Documents/argo-tutorial/.venv/lib/python3.12/site-packages/cartopy/mpl/feature_artist.py:143: UserWarning: facecolor will have no effect as it has been defined as "never".
warnings.warn('facecolor will have no effect as it has been '
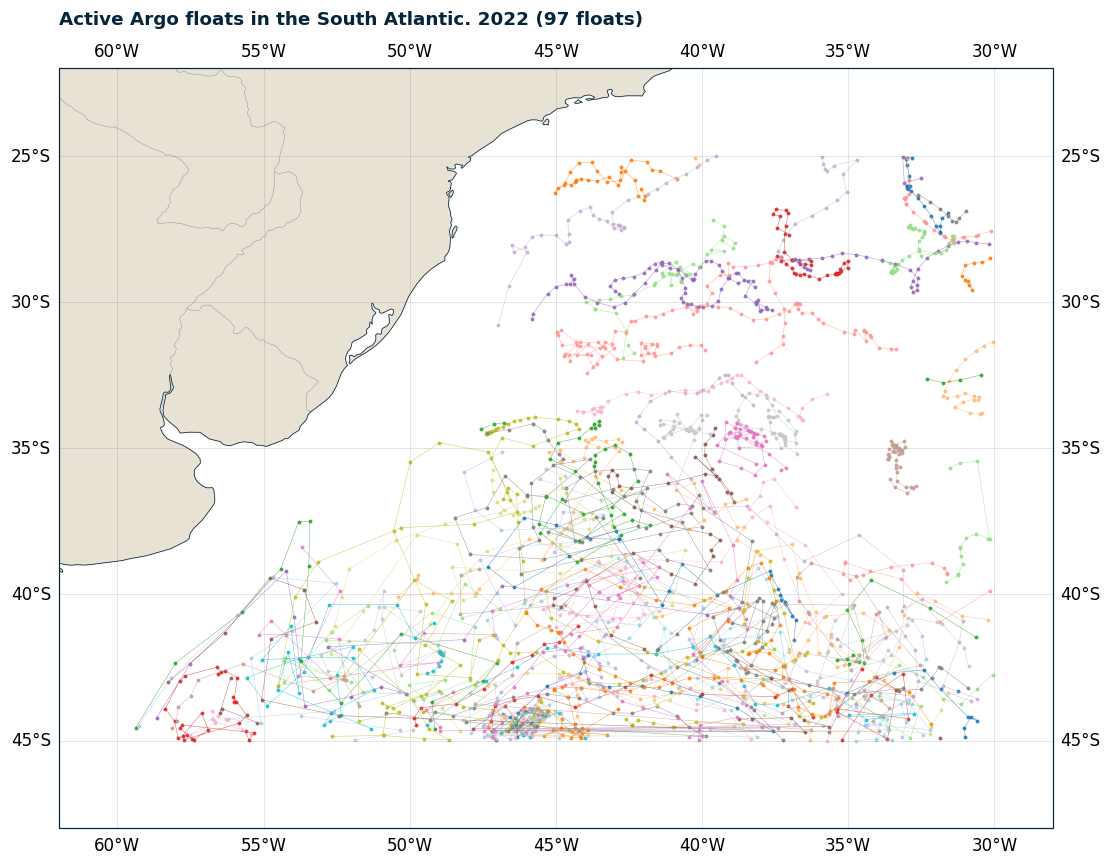
This shows the program’s typical coverage: the South Atlantic is reasonably sampled, with floats spread out and concentrated in active areas like the confluence.
Summary
LONGITUDE,LATITUDE,TIMElive at the profile level (not the pressure level).cartopyfor maps:subplot_kw={'projection': ccrs.PlateCarree()}andtransform=ccrs.PlateCarree()on all plots.For multiple floats, group by
PLATFORM_NUMBER.The track with scatter colored by time shows the regional dynamics.